
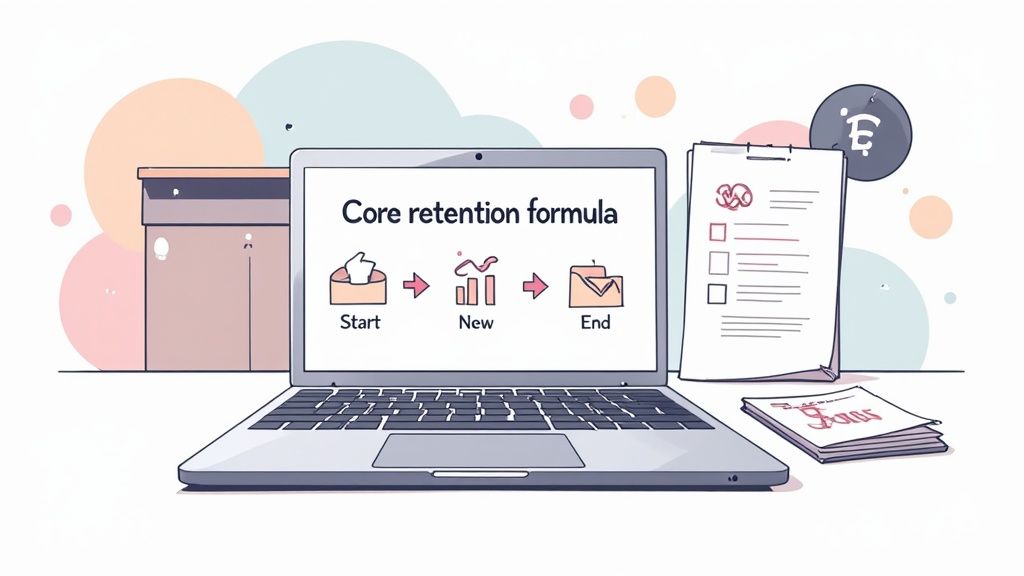
To figure out your customer retention rate, you take your total customers at the end of a period, subtract any new customers you gained during that time, divide that number by the customers you started with, and multiply by 100.
It's a simple formula that gives you a vital sign for your business: the percentage of customers you've managed to keep. For any subscription-based company, this number is gold.
Why customer retention rate is a core business metric

Before we get into the nitty-gritty of the math, let's be clear on why this metric is so critical. Your customer retention rate isn't just a number to report, it's a direct reflection of your product's value and how happy your customers are.
Think of it as the pulse of your business. A strong, steady pulse means you're healthy and built to last. A weak one signals problems that need your immediate attention. After all, a rising retention rate has a huge impact on your bottom line; keeping an existing customer is always cheaper than finding a new one.
A high retention rate tells you that you've found product-market fit and you're delivering on your promise. It's the ultimate proof that customers see value in what you offer and are choosing to stick around for it.
The go-to formula for retention
To actually measure your success, you need a reliable tool. The industry-standard customer retention rate formula, often written as CRR = [(E−N)/S]×100, has been the bedrock for this since the early 2000s.
It takes the number of customers at the end of a period (E), subtracts the new customers you signed up (N), and divides the result by your starting customer count (S). Multiplying by 100 just turns it into a percentage.
Let's break down each piece of that formula.
Breaking down the customer retention rate formula
| Variable | What it means | Example |
|---|---|---|
| S (Starting Customers) | The total number of customers you had at the beginning of the period. | You start the month with 500 customers. |
| E (Ending Customers) | The total number of customers you had at the end of the period. | By the end of the month, you have 530 customers. |
| N (New Customers) | The number of new customers acquired during that specific period. | You signed up 50 new customers this month. |
The calculation gives you a clear percentage, but its real power is in the story it tells. A sudden dip in retention might mean a new feature missed the mark. An increase could validate a recent change to your pricing or onboarding flow.
Speaking of which, things like implementing effective customer onboarding best practices are exactly what move this needle, fostering loyalty right from the start.
How retention powers growth
Ultimately, focusing on retention is what fuels sustainable growth. Loyal, long-term customers don't just stick around; they become more valuable over time.
They are far more likely to:
- Spend more: They upgrade their plans, buy add-ons, and their lifetime value just keeps climbing.
- Become your best marketers: Happy customers provide powerful, free word-of-mouth marketing by referring new business.
- Give you priceless feedback: They’re invested in your product and will give you the honest insights you need to improve.
By regularly calculating your customer retention rate, you get a clear, actionable metric that helps you make much smarter decisions for your business.
Putting the core formula to work: a practical guide
Alright, enough with the theory. The best way to really get a feel for customer retention is to run the numbers yourself. Let's walk through a straightforward, real-world example.
Imagine you're running a growing B2B SaaS company. We're going to find the numbers you need, plug them into the formula, and see what story they tell.
Gathering your essential data
First things first, you need to define your timeframe. For most SaaS businesses, looking at this quarterly gives you a stable, meaningful picture without overreacting to monthly blips. Let's use the most recent quarter: April 1st to June 30th.
Now, you'll need to pull three key numbers from your CRM or billing system:
- S (Starting Customers): How many active customers did you have on April 1st?
- E (Ending Customers): How many active customers did you have on June 30th?
- N (New Customers): How many brand-new customers did you acquire during that period?
Let's say you dig into your data and find these figures:
- You kicked off the quarter with 500 customers. (S = 500)
- You wrapped up the quarter with 540 customers. (E = 540)
- You brought on 75 new customers along the way. (N = 75)
Got it? With just these three numbers, we’re ready to roll.
Plugging the numbers into the formula
As a quick reminder, the formula is CRR = [(E - N) / S] x 100. Now we just swap the letters for our numbers.
Here’s how it breaks down:
Figure out how many existing customers stuck around. To do this, you subtract the new customers you gained from your final customer count. This isolates the group you actually retained.
- 540 (E) - 75 (N) = 465 retained customers.
Calculate the retention ratio. Now, divide that number of retained customers by the number you started with. This gives you the core ratio.
- 465 / 500 (S) = 0.93
Turn it into a percentage. The final step is to multiply by 100 to get a clean percentage.
- 0.93 x 100 = 93%
Boom. Your customer retention rate for the quarter is 93%.
This means that for every 100 customers you had when the quarter started, 93 were still with you at the end. It's a single, powerful metric that speaks volumes about your customer loyalty and the value your product delivers.
Knowing this number is the critical first step. It tells you if your strategies are landing and where you might need to dig deeper. To get the full picture, you need to understand churn, too. Exploring guides on AI-powered churn rate analysis can give you powerful insights into the other side of the retention coin, helping you understand not just who stays, but why others leave.
Moving beyond the basics with cohort analysis
Calculating your overall customer retention rate gives you a vital, top-line health metric. It’s a great start, but it’s just a snapshot. It tells you what happened, not why.
This is where cohort analysis comes in. It moves beyond a single, blended number to tell the complete story of your customer relationships over time. This approach is where some of the most powerful insights about your business are hiding.
What exactly is a cohort?
A cohort is simply a group of customers who share a common characteristic. For retention analysis, the most common way to group them is by when they signed up.
You could define cohorts like:
- The January crew: All new customers who signed up in January.
- The Q1 class: Everyone who joined during the first quarter.
- The summer campaign group: Users who converted from a specific summer marketing campaign.
By grouping users this way, you can track the behavior of each specific group over the following weeks, months, or quarters. It lets you compare different groups and finally understand how changes you make to your business actually impact long-term loyalty.
A single retention number is like knowing the final score of a game. Cohort analysis is like watching the game tape, it shows you every play and reveals exactly where you won or lost.
A practical e-commerce cohort example
Let's make this real. Imagine you run a direct-to-consumer e-commerce brand selling sustainable home goods. You need to know which of your marketing efforts bring in loyal, repeat customers, not just one-time buyers.
You decide to create two cohorts based on the campaigns that brought them in:
- Cohort A (January): Customers acquired through a 20% off first-purchase discount promoted on social media.
- Cohort B (February): Customers acquired through a content marketing campaign focused on your brand’s sustainability mission, with no initial discount.
At first glance, the January campaign looked like a huge success because it drove 30% more initial sales than the February one. But when you track their behavior over the next six months using cohort analysis, a very different story emerges.
Uncovering the truth with cohort data
You track the percentage of each cohort that makes a second, third, and fourth purchase.
Here’s what you find:
| Month after first purchase | Cohort A (discount-driven) retention | Cohort B (mission-driven) retention |
|---|---|---|
| Month 1 | 15% made a 2nd purchase | 25% made a 2nd purchase |
| Month 3 | 8% made a 3rd purchase | 20% made a 3rd purchase |
| Month 6 | 3% made a 4th purchase | 18% made a 4th purchase |
The data is crystal clear.
Although Cohort A was larger, its members were primarily deal-seekers who rarely came back. Cohort B, on the other hand, was made up of customers who connected with your brand's values. They were far more likely to become repeat buyers, ultimately generating significantly more lifetime value.
This insight is a game-changer. Without cohort analysis, you might have doubled down on discount-based advertising. With it, you now know that investing in content that highlights your brand's mission is the key to attracting and retaining your most valuable customers. That’s how to calculate customer retention rate in a way that truly drives strategic decisions.
Understanding customer vs revenue retention
It’s easy to fall into the trap of thinking that retaining a customer is the same as retaining their revenue. But they tell you two very different, and equally important, stories about your business.
Losing five customers on your starter plan stings, sure. But losing one enterprise client? That's a whole different level of pain.
For any SaaS business, tracking both customer retention and revenue retention is absolutely non-negotiable. One tells you if your product has staying power, while the other tells you if your business model is actually working.
What is revenue retention and why it matters
Revenue retention, which you'll often hear called Net Revenue Retention (NRR) or Net Dollar Retention (NDR), tracks how much recurring revenue you've held onto from your existing customers over a specific period.
While customer retention is a simple headcount, NRR is all about the money. It factors in all the financial movement from your retained customer base.
This includes:
- Expansion revenue: The extra cash from customers upgrading to a bigger plan.
- Contraction revenue: The revenue you lose when customers downgrade.
- Churned revenue: The MRR that walks out the door when customers cancel.
Why is this so critical? Because it’s tied directly to your Customer Lifetime Value (CLV). A tiny bump in retention can have an outsized impact on your bottom line. In fact, some studies show a mere 5% increase can boost profits anywhere from 25% to 95%. That's a powerful connection, and it’s why getting this measurement right is so crucial for financial planning. For a deeper dive, check out some of the research on retention profitability from Yotpo.
A tale of two retention metrics
Let's look at a common scenario for a SaaS company at the start of a new quarter:
- Customer Retention Rate: 95%
- Net Revenue Retention (NRR): 110%
At first glance, those numbers might not seem to add up. How did you grow revenue when you actually lost 5% of your customers?
The secret is in the behavior of the 95% who stuck around.
While the business lost a handful of lower-value customers, the remaining loyal users more than made up for that lost revenue by upgrading their plans, adding more seats, or buying add-ons. An NRR over 100% is a fantastic sign of a healthy business that's successfully growing with its existing customer base.
This situation highlights a fundamental truth: not all customers are created equal from a revenue perspective.
To put it simply, let's break down what each metric really tells you.
Customer retention vs revenue retention at a glance
This table cuts through the noise and shows you what each metric is for and the key question it answers.
| Metric | What it measures | Best for | Key question answered |
|---|---|---|---|
| Customer Retention | The percentage of customers who remain with you over time. | Understanding product stickiness and customer satisfaction. | Are people finding ongoing value in our product? |
| Revenue Retention | The percentage of recurring revenue retained from existing customers. | Assessing financial health and scalability. | Are our existing customers becoming more valuable over time? |
By tracking both, you get the full story. A high customer retention rate proves your product is solving a real problem. A high NRR shows your pricing and product strategy is hitting the mark, encouraging customers to spend more as they grow with you.
That’s the engine of sustainable SaaS growth right there.
Common mistakes that distort your retention data
You've got the formula down, which is a great start. But a few common mistakes can easily throw off your retention numbers, giving you a false sense of security or triggering unnecessary panic. Getting clean, reliable insights means watching out for these pitfalls.
One of the most frequent errors I see is picking the wrong time window for your business model. If you’re a SaaS company, calculating retention monthly makes perfect sense.
But what if you sell ski equipment? A monthly calculation in July would look abysmal and tell you nothing. Your customers are on an annual cycle, so a quarterly or yearly timeframe is the only way to get a true picture of their loyalty.
What is an 'active' customer, anyway?
Another classic mistake is having a fuzzy definition of an “active” customer. Is it someone who logged in this month? Someone who completed a key action? Or just anyone with a paying subscription?
If you don't have a firm, consistent definition, your numbers will swing wildly for reasons that have nothing to do with actual churn.
A project management tool, for example, might define an active user as someone who has created or completed a task in the last 30 days. Simply counting logins would inflate their numbers, lumping in users who aren't getting any real value from the platform anymore.
Be ruthless with your definition of an active user. It should directly reflect someone receiving tangible value from your product. A vague definition will only hide problems until it's too late to fix them.
Stop lumping all your customers together
Finally, a massive oversight is treating all your customers as one big, uniform group. When you throw everyone into a single calculation, you can easily mask serious issues brewing within specific segments.
Imagine a SaaS company with two main customer types: small businesses and enterprise clients. Their overall retention rate looks pretty good at 85%.
But when they segment the data, a worrying trend appears:
- Small Business Retention: 95%
- Enterprise Client Retention: 60%
Yikes. While their SMB segment is rock-solid, they're bleeding high-value enterprise clients at an alarming rate. The blended average completely hid this critical problem.
This is exactly why learning how to calculate customer retention for different segments is just as important as knowing the basic formula. Avoiding these common mistakes ensures your data is telling you the real story.
Frequently asked questions
Let's dig into a few common questions that always come up when people start calculating customer retention. This should clear up some of the trickier points and help you put this all into practice.
What is a good customer retention rate?
This is the million-dollar question, isn't it? The honest answer: it completely depends on your industry. There's no magic number that fits every business.
For a B2B SaaS company, an annual retention rate over 90% is a pretty solid benchmark. But if you're an e-commerce brand, a repeat purchase rate around 30% could be a massive win. It’s all about context.
Instead of getting hung up on a universal number, here’s what you should do:
- Research the average retention for your specific industry.
- Benchmark against your direct competitors, if you can get that data.
- Most importantly, focus on improving your own numbers month over month.
Steady, internal improvement is a much healthier sign of a strong business than just hitting some arbitrary external benchmark.
How often should I calculate this metric?
The right cadence really hinges on your business model and your customers' purchase cycle. A one-size-fits-all approach can easily mislead you.
If you're running a subscription service, like a SaaS platform or a media site, calculating retention monthly is the way to go. It lines up perfectly with your billing cycles and gives you a real-time pulse on churn signals.
But if your business has a longer, more irregular purchase cycle, like an online furniture store or a high-end consultancy, a quarterly calculation will give you a much more stable and meaningful trend line. Monthly data in that case would just be too noisy.
Choose a frequency that mirrors the natural rhythm of your customer relationships. The goal is to get a clear signal, not just data for the sake of data.
Can my customer retention rate be over 100 percent?
This is a great question, and it's one that trips a lot of people up.
When you're talking specifically about customer retention rate, a simple headcount of customers, the answer is no. You can't retain more customers than you started with, so 100% is the ceiling. Simple as that.
However, your Net Revenue Retention (NRR) can absolutely go past 100%, and when it does, it's a fantastic sign for your business.
This happens when the new revenue from your existing customers (think upgrades, add-ons, or increased usage) is greater than the revenue you lost from customers who churned or downgraded. An NRR over 100% means your company is growing even without adding a single new customer. It's a powerful signal of a healthy, scalable business model.
Losing customers is part of business, but it doesn't have to be a blind spot. Juttu transforms your cancel button into a powerful retention engine. By understanding exactly why customers are leaving in real-time, you can present personalized alternatives that convince them to stay. Stop churn at the source and see how many valuable customers you can save. Learn more at Juttu.